
Track Portfolio Performance
Build real-time portfolio views with live valuation, performance tracking, and attribution insights. Live portfolio value updates • Historical performance curves • Attribution breakdowns • Integrated market data pipeline
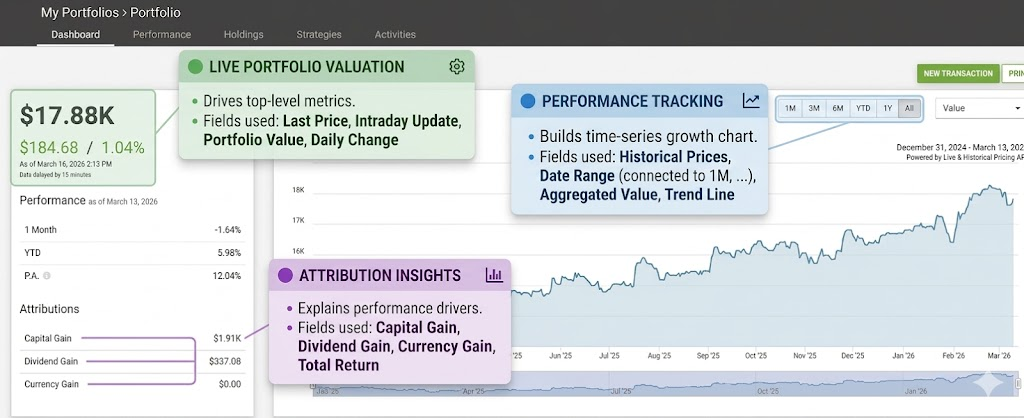
What You Can Build
Display total portfolio value, daily gains, and percentage changes in a clean summary view.
Visualize portfolio growth over time using historical pricing across all holdings.
Show how capital gains, dividends, and currency impact total performance.
Enable users to switch between 1M, 3M, YTD, and full-history performance views.
Continuously update portfolio value using intraday price feeds refreshed every 15 minutes.
Power investor-facing dashboards with intuitive performance and holdings insights.
AI Generated Image
How It Works
1. Identify Entities
Portfolio holdings define the structure—each position contributes to total value and performance calculations.
2. Combine Data Sources
Historical price data builds the performance curve, while intraday quote data updates current portfolio value throughout the day.
3. Structure & Normalize Data
Prices are aligned across time and aggregated to compute total value, returns, and attribution metrics.
4. Power Applications
The result is a fully interactive dashboard with live value, performance trends, and breakdowns like gains and dividends.
Included API resources
API used to build the portfolio dashboard above:
Build Real-Time Portfolio Experiences
Turn market data into intuitive portfolio dashboards that users rely on daily. From live valuation panels to performance charts and attribution insights, this infrastructure powers the full portfolio experience.
Designed for scalability and seamless integration, it fits into everything from retail investment apps to institutional platforms.
Updated 4 months ago