
North American Indices and Sector Performance
Index data, historical trends, and sector performance come together in one interface. Real-time market snapshot • Trend visualization • Sector-level insights • One unified experience
What You Can Build
Deliver real-time snapshots of major indices, combining price movements, trends, and macro-level signals into a single interface.
Equip analysts with historical price data and sector breakdowns to support deep equity and macro research workflows.
Build tools that visualize sector rotation, performance dispersion, and market leadership across industries.
Integrate market benchmarks and sector performance to contextualize portfolio returns and risk exposure.
Automate ingestion of index quotes, historical series, and classification data into internal analytics systems.
Create intuitive investor experiences with charts, live data, and performance summaries tailored for end users.
AI Generated Image
What You’re Looking At
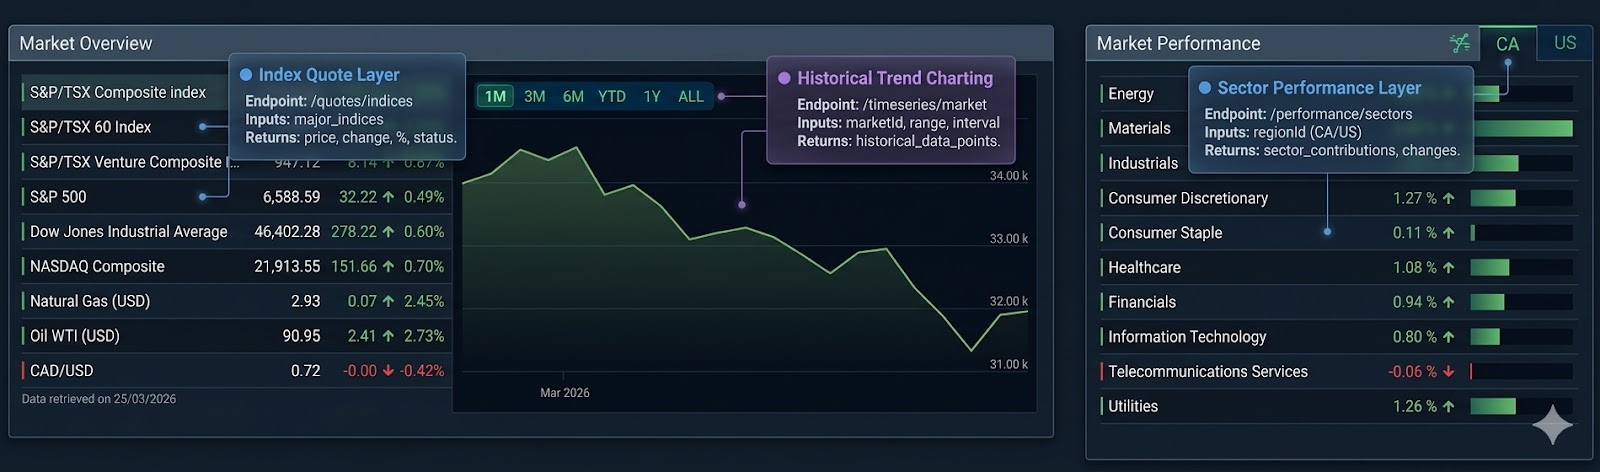
This interface is a complete market overview, built by combining multiple data layers into a single, intuitive experience.
Each section of the screen answers a different question — and together, they give users a full understanding of the market in seconds.
The Product Thinking Behind This
This interface isn’t random — it reflects how financial users think:
- Scan the market quickly
- Understand the trend
- Identify the drivers
That flow is exactly what this layout delivers.
And each step is powered by a different data layer working together seamlessly.
How These Pieces Work Together
Individually, each component is useful. Together, they create a complete market narrative:
| Section | Insight Delivered |
|---|---|
| Index Quotes | Immediate market direction |
| Historical Chart | Context and trend |
| Sector Performance | Underlying drivers |
This combination allows users to go from:
“The market is up” to “The market is up because technology and industrials are leading, and this follows a longer upward trend”
How It Works
1. Identify Market Entities
Start by selecting indices, sectors, or securities that define your market view. This creates the foundation for any dashboard, analytics tool, or reporting system.
2. Combine Data Sources
Leverage multiple APIs together—index quotes for real-time snapshots, historical endpoints for trend analysis, and stock quote data for sector-level performance—to create a unified dataset.
3. Structure & Normalize Data
Align fields across endpoints into consistent formats, enabling seamless comparison between indices, time periods, and sectors without fragmentation.
4. Power Applications
Deliver the data into dashboards, analytics engines, or client-facing platforms—transforming raw market data into actionable financial intelligence.
Included API resources
Built as part of a broader financial data eco
Powers the real-time market snapshot — delivering live index levels, price changes, and macro signals like energy and currency.
Drives the interactive chart — enabling users to explore trends, timeframes, and market cycles with structured time series data.
Fuels the sector performance panel — showing which industries are leading or lagging the market in real time.
Updated 4 months ago