
Breakdown a portfolio allocation
Turn portfolio holdings into rich, visual allocation insights across sectors, countries, assets, and currencies
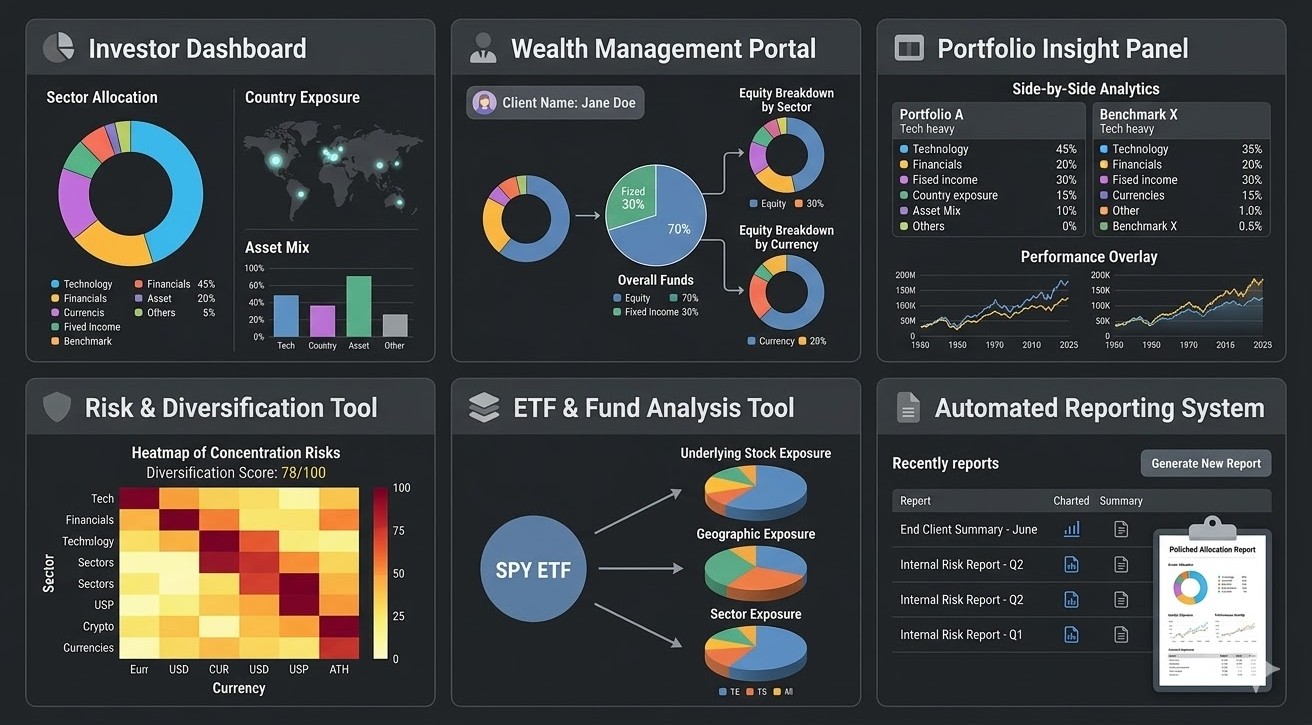
What You Can Build
Deliver clean, visual portfolio breakdowns like sector allocation, country exposure, and asset mix—exactly like modern investment platforms.
Provide clients with intuitive views of how their money is allocated across markets, sectors, and currencies.
Build side-by-side analytics panels showing allocation splits, exposure summaries, and performance overlays.
Identify concentration risks and diversification gaps across sectors, geographies, and currencies.
Break down funds into their underlying exposures to help users understand what they actually own.
Generate polished allocation reports with charts and summaries for internal teams or end clients.
AI Generated Image
How It Works
1. Start with Any Portfolio
Whether it's a client account, ETF, or model portfolio, simply pass in holdings with weights. The system is flexible enough to support any structure—from simple portfolios to complex allocations.
2. Instantly Map Exposure Across Dimensions
Each position is automatically classified across multiple layers—sector, country, asset class, and currency—creating a complete exposure profile behind the scenes.
3. Standardize Into Visual-Ready Data
All outputs are normalized into clean allocation weights, making them immediately usable for charts, dashboards, and reporting interfaces.
4. Power Frontend Experiences
The result is exactly what modern users expect: pie charts, allocation panels, and performance tables—ready to drop into investor dashboards and analytics platforms.
Related Resources
Extend this into a full investment intelligence platform.
Build What Modern Investors Expect
Today’s investors don’t just want holdings—they want clarity.
This portfolio allocation intelligence layer transforms raw position data into intuitive, visual, and actionable insights that power the exact experiences users expect: clean dashboards, exposure breakdowns, and performance views.
Whether you're building a fintech product, wealth platform, or institutional analytics system, this API gives you the infrastructure to deliver professional-grade portfolio intelligence at scale.
Updated 4 months ago