
Financial Ratios & Custom Reporting Solution
Build powerful equity research dashboards and long-term financial reports using structured financial metrics across valuation, profitability, growth, and capital structure. Turn raw financial fields into custom investor reports with up to 20 years of historical data for deep analysis, benchmarking, and decision-making.
What you can build
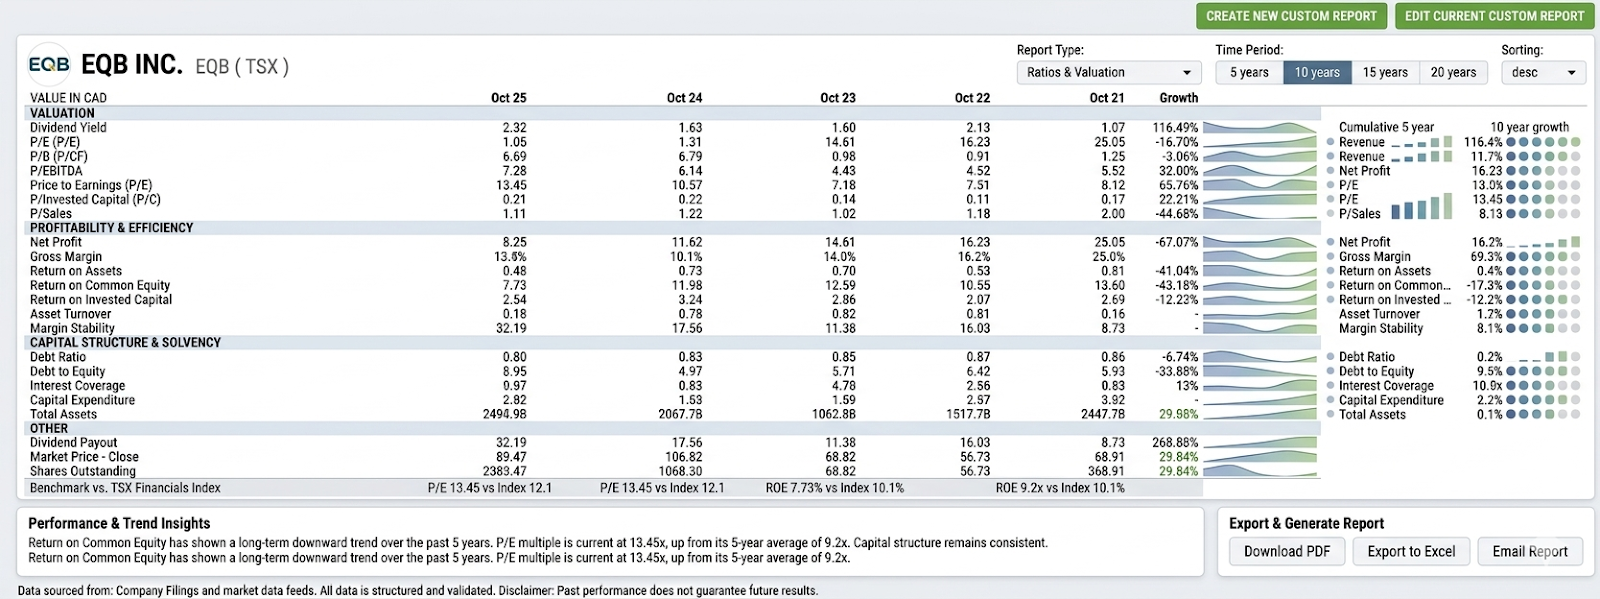
Generate multi-year financial reports across valuation, profitability, and balance sheet metrics in a single view.
Track ratios like P/E, P/B, EV/EBITDA, and price-to-cash-flow over time.
Analyze margins, net profit, ROE, ROA, and return on capital across multiple periods.
Monitor debt ratios, leverage, and equity structure evolution over time.
Visualize revenue, earnings, and financial growth patterns with historical comparisons.
Build research terminals and investor dashboards with clean, sortable, and visualized financial data.
AI Generated Image
Transform financial data into investor-grade reports
This solution enables you to move beyond static financial statements and build dynamic, multi-year financial reports that highlight how a company evolves over time.
Custom equity research reports
Let users generate tailored reports by selecting specific financial fields such as revenue, net income, ROE, debt ratios, or valuation multiples. These reports can be structured exactly like institutional research outputs.
Investor-facing analytics platforms
Turn financial data into intuitive dashboards with trend indicators, growth visuals, and performance signals that help users quickly interpret company fundamentals.
Included API Resources
Retrieve selected financial metrics across valuation, profitability, and balance sheet categories.
Access long-term financial history to power trend analysis and research workflows.
Build dynamic reports based on user-selected fields and parameters.
Compare multiple companies across the same dataset for benchmarking.
Use latest, TTM, or annual data depending on the analytical need.
Deliver clean, structured financial data ready for dashboards and visualizations.
Core capabilities
| Capability | What it enables |
|---|---|
| Flexible field selection | Build custom reports using selected financial metrics |
| Multi-year data access | Analyze trends over 5, 10, or up to 20 years |
| Multi-company comparison | Compare financial metrics across multiple securities |
| Context-based metrics | Use latest, TTM, or annual data depending on use case |
| Valuation analytics | Track P/E, P/B, EV/EBITDA, and other valuation ratios |
| Profitability analysis | Analyze margins, ROE, ROA, and earnings performance |
| Capital structure insights | Monitor leverage, debt ratios, and equity changes |
| Growth visualization | Highlight long-term trends and performance shifts |
Final takeaway
This solution transforms financial metrics into powerful investor tools. By combining flexible field selection, long-term data access, and structured outputs, you can build custom financial reports and dashboards that go far beyond traditional financial statement views.
Updated 4 months ago