
Financial Statement Dashboard Solution
Build clean, structured financial statement experiences for investor platforms, research products, and company fundamentals dashboards. Power income statement, balance sheet, and cash flow dashboards with column-based financial data that supports reporting views, time-series comparison, and flexible presentation logic.
What you can build
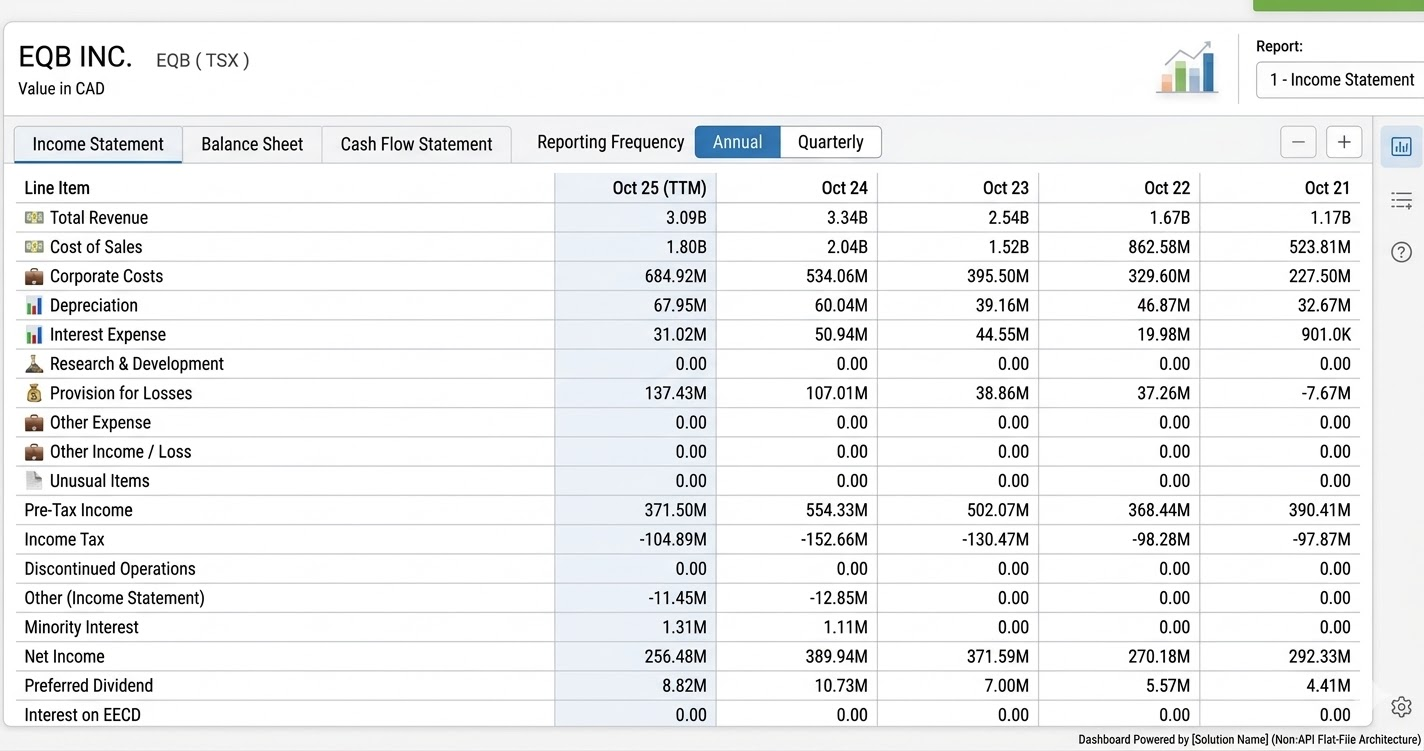
Build company financial dashboards with structured statement rows and period columns across multiple fiscal periods.
Let users switch between income statement, balance sheet, and cash flow views inside one company research experience.
Show quarterly or annual statement views side by side for trend analysis and period-over-period review.
Support different label types for investor-facing views, standardized displays, or internal product logic.
Use processing type options to tailor the statement experience for cleaner analytics or filing-faithful presentation.
Power company research pages, financial terminals, issuer dashboards, and fundamentals analysis tools.
AI Generated Image
Company financial statement dashboards
Create a clean financial interface where users can open a company and immediately review revenue, expenses, operating income, taxes, net income, assets, liabilities, or cash flow items in a structured table.
Multi-period reporting views
Use the columns structure to show fiscal year, quarter, and period-end dates across multiple reporting periods. This is ideal for “last 4 quarters,” “last 5 years,” or annual-versus-quarterly views.
Fundamentals terminals and research products
Combine this endpoint into research workstations where users can switch statement type, report type, currency context, label type, and processing logic without leaving the company page.
Included API Resources
Present revenue, expenses, operating income, taxes, and net income in a structured multi-period layout.
Show assets, liabilities, and equity with clear period comparison for capital structure analysis.
Surface operating, investing, and financing cash flow items for liquidity and cash generation analysis.
Core capabilities
| Capability | What it enables | Parameter or response support |
|---|---|---|
| Statement selection | Switch between core financial statements | statementType |
| Reporting view control | Support different reporting formats | reportType |
| Label flexibility | Show statements with different naming conventions or presentation styles | labelType |
| Processing control | Choose how statement data is prepared for display or analysis | processingType |
| Company lookup | Load a company statement by symbol and exchange | securityIdSource, securityId |
| Multi-period comparison | Show multiple years or quarters side by side | columns[] |
| Structured line items | Render readable financial rows with hierarchy and labels | rows[] |
| Filing detail support | Retain filing-level value detail for accuracy and traceability | cellValues[], filingDate |
| Currency-aware dashboards | Present values consistently with statement metadata | summary.currency, defaultPrecision |
Final takeaway
This financial statement API provides the foundation for building polished company fundamentals dashboards. With structured rows, period-aware columns, labeling controls, and reporting options, you can create research experiences that feel closer to a financial terminal than a raw filing viewer.
Updated 4 months ago